The Difference a Year Can Make in Patient Access and Provider Adoption
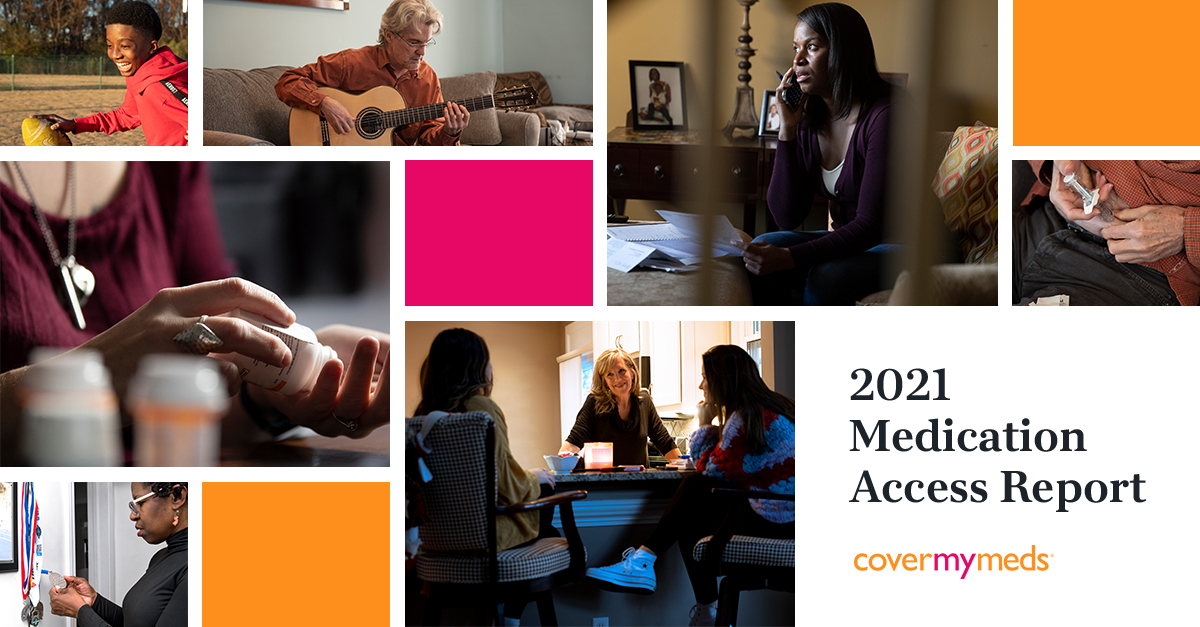
In our 2021 Medication Access Report, we compared key insights from our 2019 and 2020 provider and patient surveys — including ePA adoption rates and patient prescription affordability responses. Presented here is a deeper dive into some of these data shifts.


While healthcare may historically trail other industries with consumer-engaging technology, changes due to the COVID-19 pandemic pushed innovation forward. Providers and patients adopted technology and switched methods to find clear paths to medications — sometimes a difficult task even in calmer times.
A comparison of our 2019 and 2020 patient and provider surveys reflects these shifts, with notable changes in how patients received their medications and how providers complete the prior authorization (PA) process.
Below, we’ve highlighted some of these key differences, signaling continued innovation and hope for the future of medication access.
For a bigger picture of the medication access landscape in 2020 — including industry research, patient interviews and provider perspectives — visit our 2021 Medication Access Report.
More Providers Chose Electronic Solutions for Benefit Barriers
PA continues to be a pain point for providers, but many more in 2020 adopted electronic solutions to more quickly and efficiently work through this perennial barrier. Those using an electronic solution jumped 16 percent from 2019 to 2020, totaling 96 percent of providers using an electronic Prior Authorization (ePA) solution. Only 3 percent are relying on solely manual (phone/fax) methods to submit PA requests, down 12 percent from 2019.

Further, more prescribers this year indicated starting PA requests prospectively, at the point of prescribing. Conversely, 5 percent more prescribers in 2020 compared to 2019 indicated starting PA requests retrospectively, or if prompted by their electronic health record (EHR).
For providers, this means faster processes and more time for critical conversations with patients. In both 2019 and 2020, providers most often expressed “reduced face-to-face time with patients” when asked what resulted from time spent on PA. Over half of providers in 2020 indicated they don’t have the time they need to complete PA requests.
For patients, greater adoption of integrated ePA technology means improved access. One study shows patients receive their medications 13.2 days sooner when their prescribers submit PA requests prospectively.CoverMyMeds data on file, 2018
When it came to specialty and complex therapies, electronic connectivity remained the theme for what providers wanted in an ideal solution. When asked, top answers in 2019 were electronic connectivity to patient financial assistance programs and the ability to complete reimbursement processes electronically, inclusive of PA and benefits investigation. In 2020, top answers for features of an ideal specialty tool were the ability to complete PA requests electronically and access to benefit information.
And when providers adopt electronic patient support services, patients have a better chance of remaining adherent to their medications. Providers using inclusive patient support services have helped their patients achieve a 34 percent reduction in time to therapy for their complex medications.CoverMyMeds data on file, 2020
To Afford and Access Medications, Patients Exercised Options
Let’s start with the good news: In 2019, three out of four patients said they went to pick up a prescription and found out it cost more than they expected. In 2020, this decreased to 67 percent of patients surveyed.
Unfortunately, patients suggest abandonment is on the rise. In 2019, 29 percent of patients who received a prescription that cost too much decided to go without their medication. This number jumped to 38 percent in our 2020 survey.
While there’s not enough data to definitively explain this jump, we know millions of Americans in 2020 became unemployed due to the COVID-19 pandemic economic fallout.9.2 million workers likely lost their employer-provided health insurance in the past four weeks, Economic Policy Institute, 2020 About half of those who lost jobs likely lost their health insurance, too.Health Insurance Coverage in the United States: 2019, The United States Census Bureau, 2020
For the uninsured and under-insured, cash may be the only option they have to pay for medications, if they can find an affordable price. Patients could benefit from providers who have point-of-prescribing affordability options that help surface the cash price of medications. Of course, there are pharmacy price shopping apps more widely available that offer this, too.

In 2020, patients indicated a greater likelihood of exercising choice and consumerism through patient-facing apps. When a prescription cost more than expected, 43 percent of patients said they checked a pharmacy comparison app to find a better price, up from 28 percent in 2019. Pharmacists are noticing this behavior: Over a third said they’ve seen patients using prescription price shopping tools daily.CoverMyMeds Pharmacist Survey, 2020
With patients more likely to look for affordability options today, pharmacists could be poised to help with the right technology at hand. From survey data, both providers and pharmacists indicated that pharmacists are more likely to help patients find affordability options for medications. Integrated solutions within a pharmacist’s workflow can help surface affordability options such as available manufacturer cost-savings programs for particular drugs and cash price.
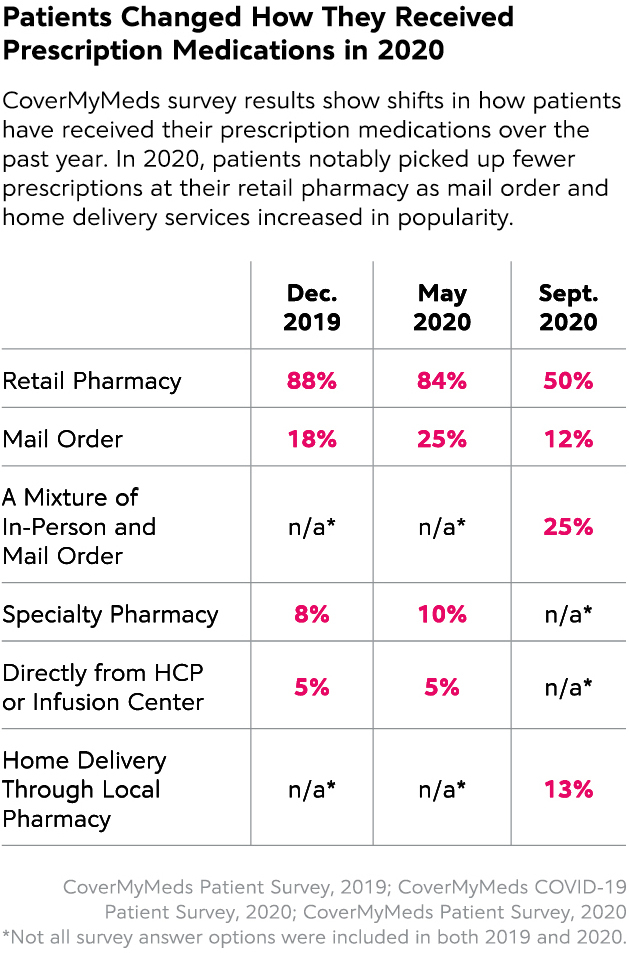
While at the pharmacy, patients also altered their medication pickup behaviors, which we tracked through our COVID-19 patient survey in May 2020. Patients picking up their prescriptions within a retail pharmacy dropped 38 percentage points from our 2019 survey to our 2020 patient survey. While we didn’t ask about home delivery options in 2019 — because few existed — 13 percent of patients in 2020 chose this option, and 25 percent chose a mix of mail order and in-person.
Discover how the industry can build better connectivity between patients and care team members through insights from our patient, provider and pharmacist surveys in the 2021 Medication Access Report.
The latest healthcare insights, floated right to your inbox.